Market Outlook
December 7, 2017
Market Cues
Domestic Indices
Chg (%)
(Pts)
(Close)
Indian markets are likely to open flat tracking global indices and SGX Nifty.
BSE Sensex
(0.6)
(205)
32,597
U.S. indices were mixed in Wednesday; however tech stock rebounded after recent
Nifty
(0.7)
(74)
10,044
sell off. The lackluster movement largely owing to uncertainty about the economy
Mid Cap
(0.9)
(149)
16,663
impact of the republican tax reform plan. President Donald trump announcement of
Small Cap
(0.7)
(118)
17,801
recognizing Jerusalem as a capital of Israel weighed the market. The NASDAQ rose
Bankex
(1.2)
(349)
28,110
0.2% to close at 6,776, the Dow dipped 0.2% to finish at 24,141 and the S&P 500
edged down a tenth of % to end at 2,629.
Global Indices
Chg (%)
(Pts)
(Close)
U.K. top share index was lifted from a two-month low on Wednesday as Brexit
Dow Jones
(0.2)
(40)
24,141
negotiations dented the pound. FTSE 100 index rose 0.5 percent to finish at 7,364.
Nasdaq
0.2
14
6,776
On domestic front, indices fell notably on Wednesday after the Reserve Bank of
FTSE
0.3
21
7,348
India left its key interest rates unchanged, as widely expected, saying the risks are
Nikkei
1.3
287
22,464
evenly balanced and inflation would be in the region of 4.3% to 4.7% in the third
Hang Seng
0.1
31
28,255
and fourth quarters of this year. The BSE Sensex fell 0.63% to close at 32,597 while
Shanghai Com
(0.3)
(10)
3,283
the Nifty index ended negative 0.73 % at 10,044.
News Analysis
Advances / Declines
BSE
NSE
RBI Holds on repo rate on inflation concern
Advances
971
560
Detailed analysis on Pg2
Declines
1,695
1,190
Unchanged
156
72
Investor’s Ready Reckoner
Key Domestic & Global Indicators
Volumes (` Cr)
Stock Watch: Latest investment recommendations on 150+ stocks
BSE
3,423
Refer Pg5 onwards
NSE
25,481
Top Picks
CMP
Target
Upside
Company
Sector
Rating
Net Inflows (` Cr)
Net
Mtd
Ytd
(`)
(`)
(%)
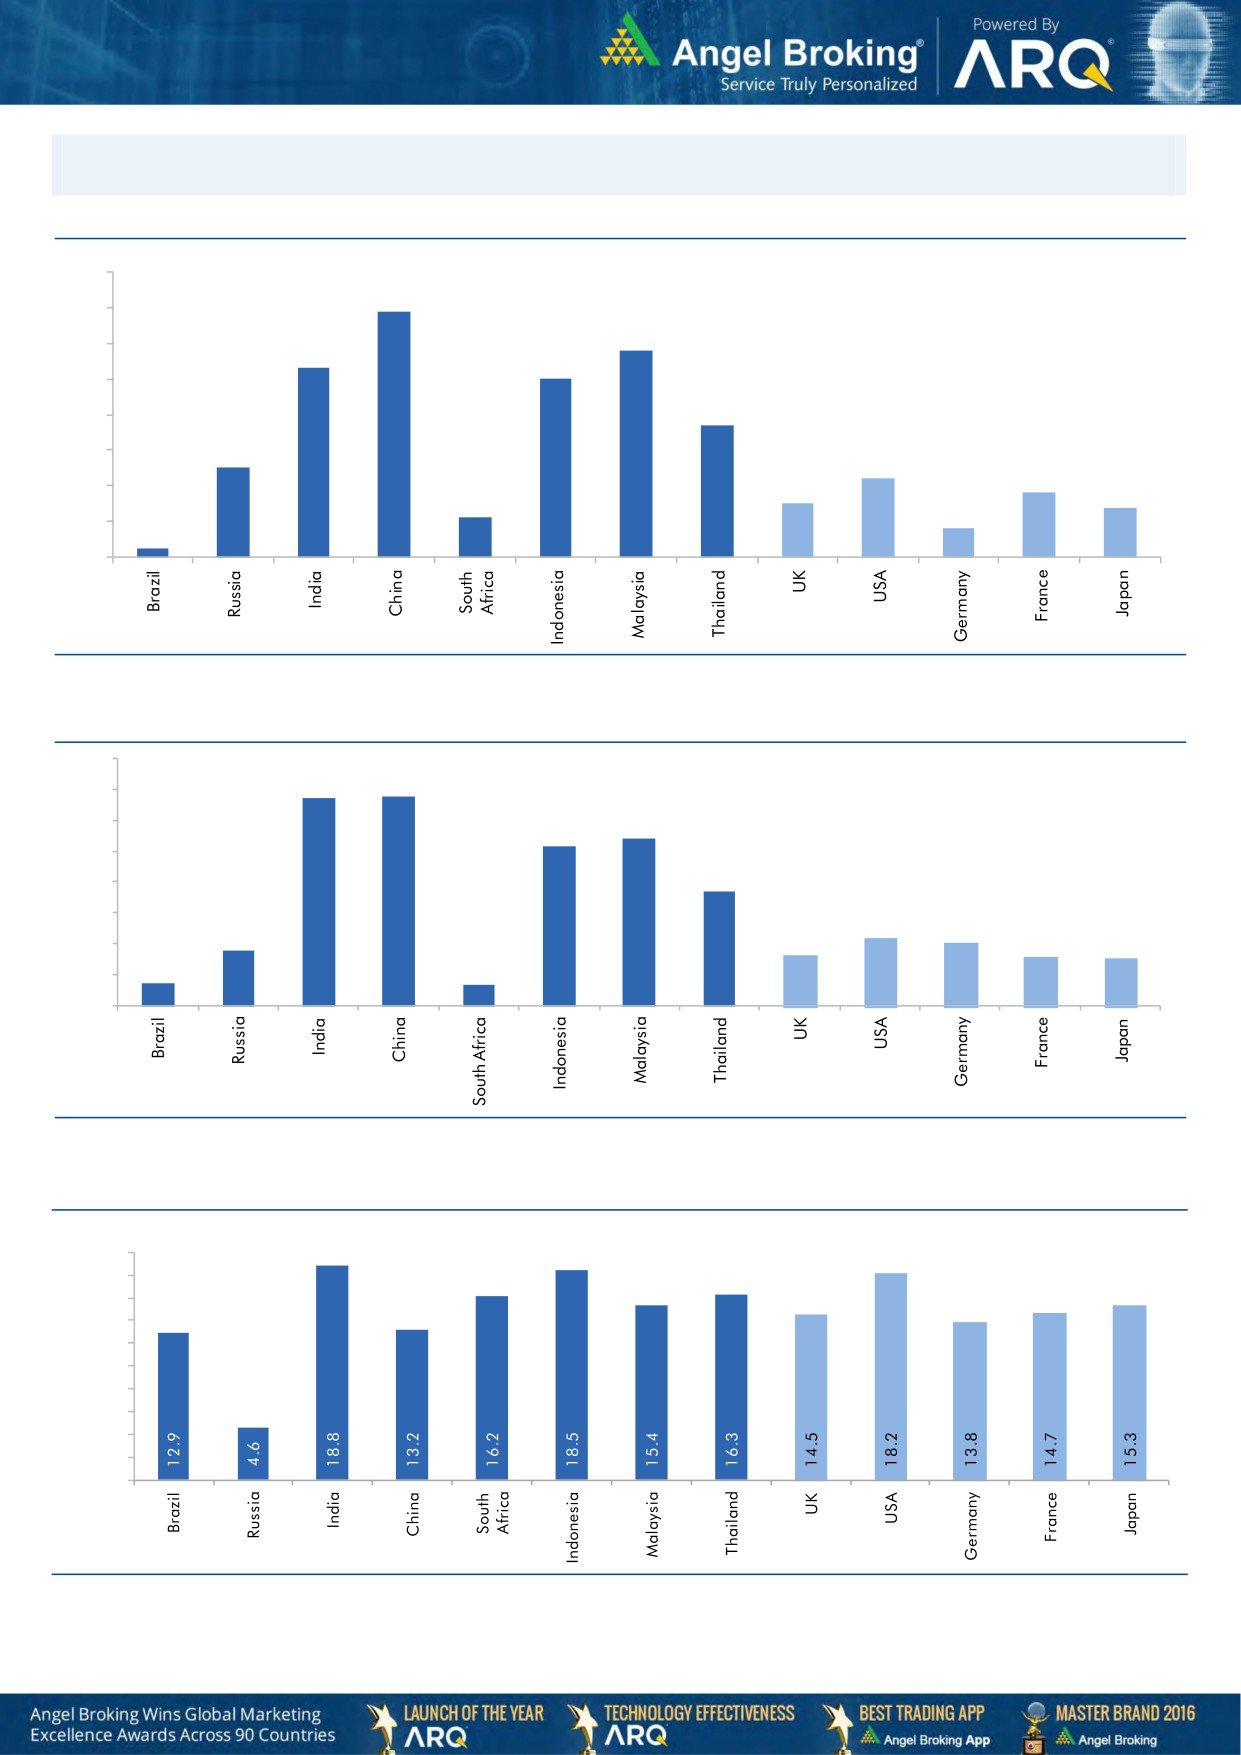
Blue Star
Capital Goods Accumulate
759
867
14.2
FII
(1,403)
(1,399)
56,233
Dewan Housing Finance
Financials
Buy
586
712
21.5
MFs
300
10,669 1,06,079
Asian Granito
Other
Buy
491
570
16.1
Navkar Corporation
Other
Buy
181
265
46.2
Top Gainers
Price (`)
Chg (%)
KEI Industries
Capital Goods Accumulate
386
425
10.1
Nilkamal
1,786
6.1
More Top Picks on Pg4
Bajajelec
473
5.6
Key Upcoming Events
Videoind
19
4.8
Previous
Consensus
Date
Region
Event Description
Rnaval
36
4.3
Reading
Expectations
Dec08
UK
Industrial Production (YoY)
2.50
Kpit
161
4.2
Dec08
India
Imports YoY%
7.60
Dec08
India
Exports YoY%
(1.10)
Top Losers
Price (`)
Chg (%)
Dec08
China
Exports YoY%
6.90
Hathway
42
(5.9)
Dec08
US
Change in Nonfarm payrolls
261.00
198.00
More Events on Pg7
Rcom
11
(4.9)
Ajantpharm
1,280
(4.7)
Ltts
1,045
(4.5)
Hindcopper
88
(4.4)
As on December 06 2017
Market Outlook
December 7, 2017
News Analysis
RBI Holds on repo rate on inflation concern
Largely along expected lines, the Monetary Policy Committee (MPC) chose to
maintain status quo on repo rates at 6% in its December 06th policy. However, the
MPC has maintained its neutral stance on rates. That leaves the reverse repo rate
at 5.75% and the bank rate at 6.25%. Among the 6 members of the MPC, only Dr.
Ravindra Dholakia voted for a 25 basis points reduction in rates while the other 5
members voted for a status quo. It may be recollected that over the last 3 years
between Jan-2015 and Dec-2017, the repo rates have been brought down by a
full 200 basis points from 8% to 6%.
The RBI has maintained its GVA guidance at 6.7% although inflation guidance has
been raised by 10 bps on the back of weak Kharif output this year. Outside of
interest rate guidance, the policy has also hinted that the bank recapitalization
package will be released in the next few days and has emphasised that
recapitalization bonds may be front loaded in case of strong banks. The MPC also
confirmed that the surplus liquidity in the financial system had been largely
neutralized by the RBI’s open market operations (OMOs). The RBI governor, Dr.
Urjit Patel, has also ruled out the possibility of any special dividend to the
government out of profits for last fiscal year
Economic and Political News
Tata Motors: Rolls out first lot of Tigor EVs from Sanand plant
DLF: Reopens sales, sells Rs 300 crore flats in Gurgaon in November
Claris Life Scienes: Board finds delisting option best for shareholders
Corporate News
Inflation data shows steady decline in general prices: Jaitley
RBI to rationalise charges on debit card transactions
FinMin to compare and contrast collections in pre-, post-GST period
Fitch cuts full-year growth forecast to 6.7%, says GDP rebound weak
Market Outlook
December 7, 2017
Top Picks HHHHH
Market Cap
CMP
Target
Upside
Company
Rationale
(` Cr)
(`)
(`)
(%)
Strong growth in domestic business due to its leade`hip
in acute therapeutic segment. Alkem expects to launch
Alkem Laboratories
24,774
2,072
2,252
8.7
more products in USA, which bodes for its international
business.
We expect the company would report strong profitability
Asian Granito
1,477
491
570
16.1
owing to better product mix, higher B2C sales and
amalgamation synergy.
Favorable outlook for the AC industry to augur well for
Cooling products business which is out pacing the
Blue Star
7,280
759
867
14.2
market growth. EMPPAC division's profitability to
improve once operating environment turns around.
With a focus on the low and medium income (LMI)
consumer segment, the company has increased its
Dewan Housing Finance
18,377
586
712
21.5
presence in tier-II & III cities where the growth
opportunity is immense.
Loan growth is likely to pick up after a sluggish FY17.
Lower credit cost will help in strong bottom-line growth.
Karur Vysya Bank
8,205
114
180
58.3
Increasing share of CASA will help in NIM
improvement.
High order book execution in EPC segment, rising B2C
KEI Industries
3,024
386
425
10.1
sales and higher exports to boost the revenues and
profitability
Expected to benefit from the lower capex requirement
Music Broadcast
2,212
388
434
11.9
and 15 year long radio broadcast licensing.
Massive capacity expansion along with rail advantage
Navkar Corporation
2,729
181
265
46.2
at ICD as well CFS augur well for the company
Strong brands and distribution network would boost
Siyaram Silk Mills
3,362
717
721
5.0
growth going ahead. Stock currently trades at an
inexpensive valuation.
Market leadership in Hindi news genre and no.
2
viewership ranking in English news genre, exit from the
TV Today Network
2,335
391
435
11.2
radio business, and anticipated growth in ad spends by
corporate to benefit the stock.
After GST, the company is expected to see higher
volumes along with improving product mix. The Gujarat
Maruti Suzuki
2,59,809
8,601
9,489
10.3
plant will also enable higher operating leverage which
will be margin accretive.
We expect loan book to grow at 24.3% over next two
GIC Housing
2,200
408
655
60.4
year; change in borrowing mix will help in NIM
improvement
We expect CPIL to report net Revenue/PAT CAGR of
~17%/16% over FY2017-20E mainly due to healthy
6,831
307
400
30.1
growth in plywood & lamination business, forayed into
Century Plyboards India
MDF & Particle boards on back of strong brand &
distribution network.
We expect sales/PAT to grow at 13.5%/20% over next
LT Foods
1,943
73
96
31.8
two years on the back of strong distribution network &
addition of new products in portfolio.
Source: Company, Angel Research
Market Outlook
December 7, 2017
Key Upcoming Events
Global economic events release calendar
Bl oomberg Data
D ate
Time
C ountry
Event Description
Unit
Period
L ast Reporte d
E stimate d
Dec 08, 2017
3:00 PM UK
Industrial Production (YoY)
% Change
Oct
2.50
India
Imports YoY%
% Change
Nov
7.60
India
Exports YoY%
% Change
Nov
(1.10)
China
Exports YoY%
% Change
Nov
6.90
7:00 PM US
Change in N onfarm payrolls
Thousands
Nov
261.00
198.00
7:00 AM China
Consumer Price Index (YoY)
% Change
Nov
1.90
1.80
Dec 09, 2017
7:00 PM US
Unnemployment rate
%
Nov
4.10
4.10
Dec 12, 2017
5:30 PM India
Industrial Production YoY
% Change
Oct
3.80
3:00 PM UK
CPI (YoY)
% Change
Nov
3.00
US
Producer Price Index (mom)
% Change
Nov
0.20
Dec 13, 2017
3:00 PM UK
Joble ss claims change
% Change
Nov
1.10
7:00 PM US
Consumer price index (mom)
% Change
Nov
0.10
0.40
Dec 14, 2017
7:30 AM China
Industrial Production (YoY)
% Change
Nov
6.20
12: 00 PM India
Monthly Wholesale Prices YoY%
% Change
Nov
3.59
5:30 PM UK
BOE Announce s rate s
% Ratio
Dec 14
0.50
0.50
6:15 PM Euro Zone
ECB announces interest rates
%
Dec 14
-
7:45 PM US
Industrial Production
%
Nov
0.94
Dec 15, 2017
3:30 PM Euro Zone
Euro-Zone CPI (YoY)
%
Nov F
1.40
Dec 18, 2017
12: 30 AM US
FOMC rate decision
%
Dec 13
1.25
1.50
Dec 19, 2017
7:00 PM US
Housi ng Starts
Thousands
Nov
1,290.00
7:00 PM US
Building permits
Thousands
Nov
1,316.00
Dec 20, 2017
8:30 PM US
Existing home sales
Million
Nov
5.48
Dec 22, 2017
8:30 PM US
New home sales
Thousands
Nov
685.00
3:00 PM UK
GDP (YoY)
% Change
3Q F
1.50
Source: Bloomberg, Angel Research
Market Outlook
December 7, 2017
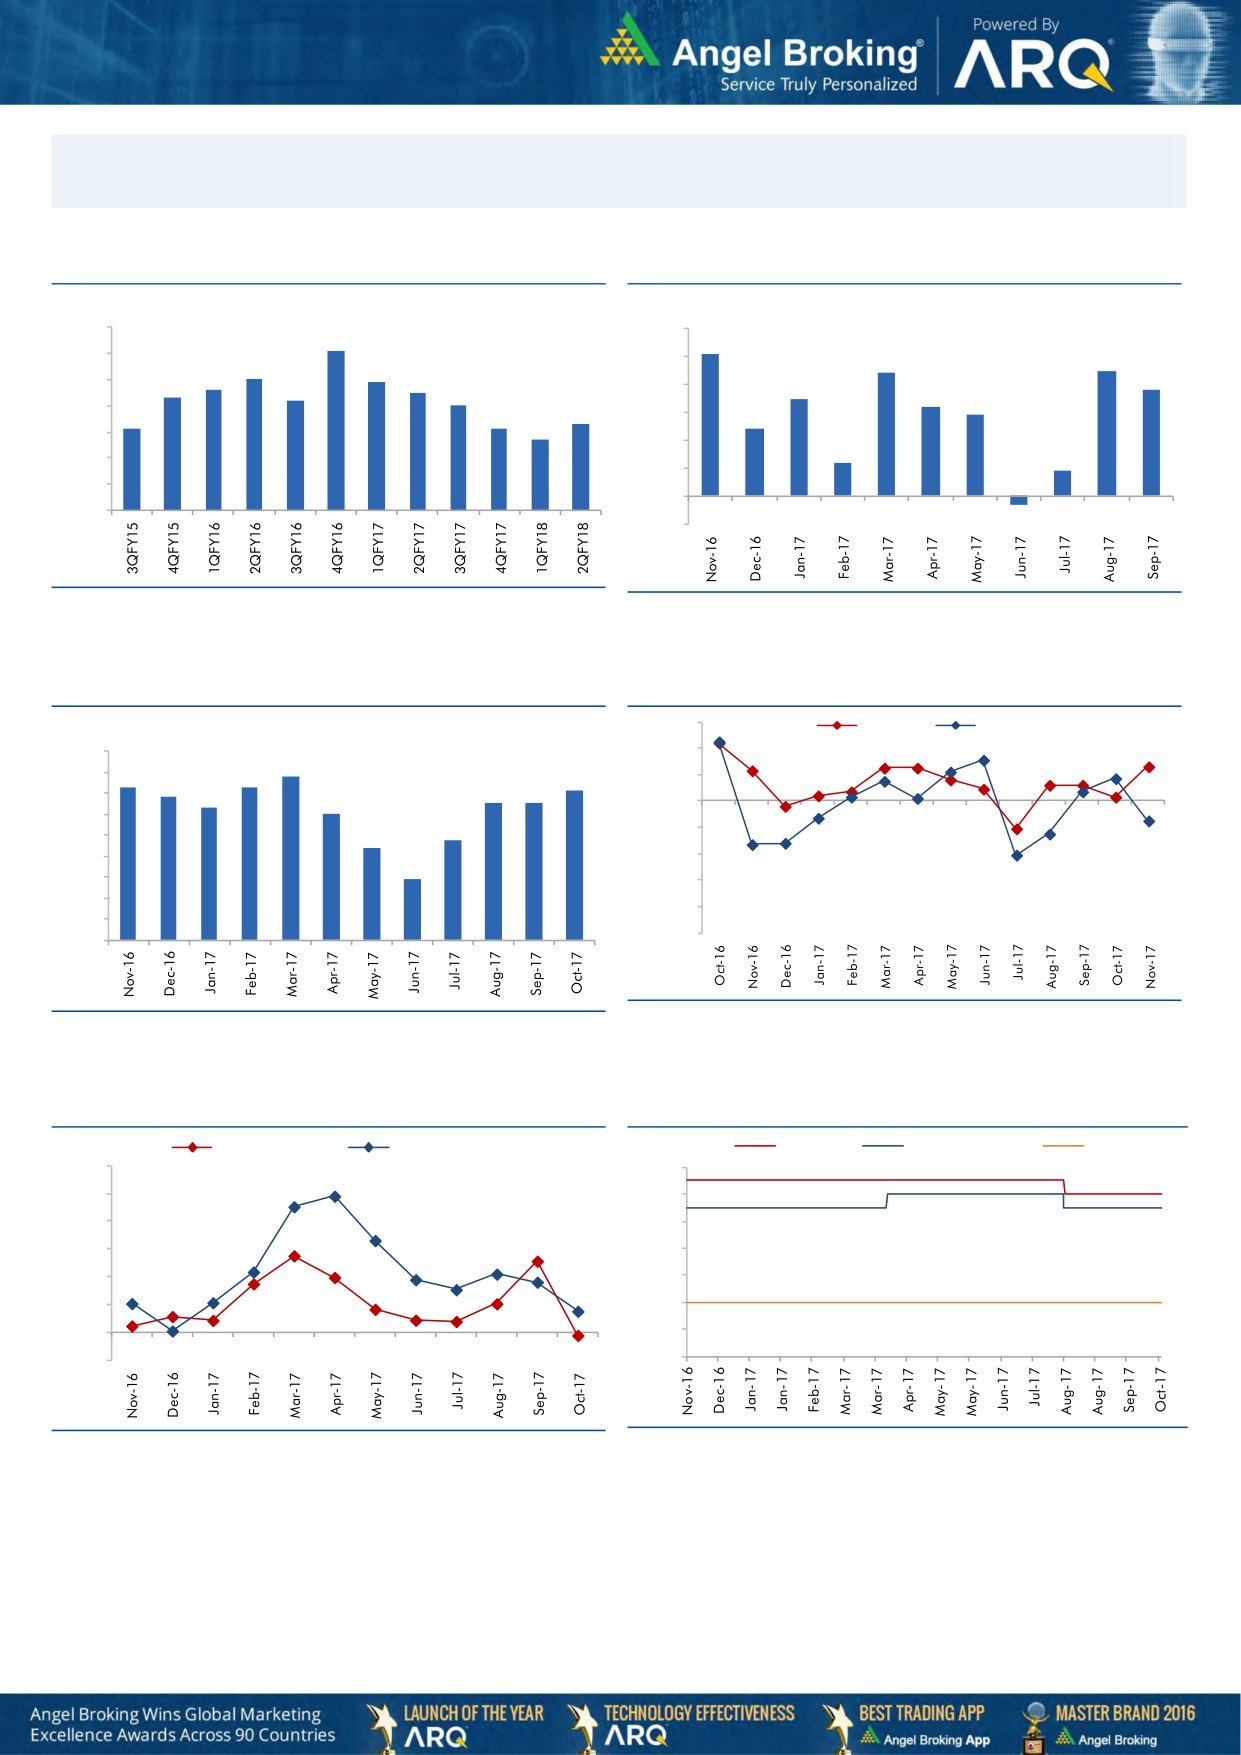
Macro watch
Exhibit 1: Quarterly GDP trends
Exhibit 2: IIP trends
(%)
(%)
10.0
6.0
9.1
5.1
9.0
5.0
4.4
4.5
8.0
7.9
7.6
7.5
3.8
8.0
7.3
7.2
4.0
3.5
7.0
3.2
2.9
7.0
6.3
6.1
6.1
3.0
2.4
5.7
6.0
2.0
1.2
5.0
0.9
1.0
4.0
-
3.0
(1.0)
(0.3)
Source: CSO, Angel Research
Source: MOSPI, Angel Research
Exhibit 3: Monthly CPI inflation trends
Exhibit 4: Manufacturing and services PMI
56.0
Mfg. PMI
Services PMI
(%)
4.5
54.0
3.9
4.0
3.6
3.7
3.6
52.0
3.4
3.2
3.3
3.3
3.5
3.0
50.0
3.0
2.4
48.0
2.5
2.2
2.0
46.0
1.5
1.5
44.0
1.0
42.0
0.5
40.0
-
Source: Market, Angel Research; Note: Level above 50 indicates expansion
Source: MOSPI, Angel Research
Exhibit 5: Exports and imports growth trends
Exhibit 6: Key policy rates
(%)
Exports yoy growth
Imports yoy growth
(%)
Repo rate
Reverse Repo rate
CRR
60.0
6.50
50.0
6.00
40.0
5.50
30.0
5.00
20.0
4.50
10.0
4.00
0.0
3.50
(10.0)
3.00
Source: Bloomberg, Angel Research
Source: RBI, Angel Research
Market Outlook
December 7, 2017
Global watch
Exhibit 1: Latest quarterly GDP Growth (%, yoy) across select developing and developed countries
(%)
8.0
6.9
7.0
5.8
6.0
5.3
5.0
5.0
1.1
3.7
4.0
2.5
3.0
2.2
1.8
2.0
1.5
1.4
0.8
1.0
0.3
-
Source: Bloomberg, Angel Research
Exhibit 2: 2017 GDP Growth projection by IMF (%, yoy) across select developing and developed countries
(%)
6.7
6.8
7.0
6.0
5.4
5.2
5.0
3.7
4.0
3.0
1.8
2.2
2.0
1.7
1.6
2.0
0.7
1.5
0.7
1.0
-
Source: IMF, Angel Research
Exhibit 3: One year forward P-E ratio across select developing and developed countries
(x)
20.0
18.0
16.0
14.0
12.0
10.0
8.0
6.0
4.0
2.0
-
Source: IMF, Angel Research
Market Outlook
December 7, 2017
Exhibit 4: Relative performance of indices across globe
Returns (%)
C ountry
Name of index
Closing price
1M
3M
1YR
Brazil
Bovespa
73,268
(0.8)
3.4
23.1
Russia
Micex
2,124
2.1
5.4
(3.8)
India
Nifty
10,044
(3.9)
0.9
23.6
China
Shanghai Composite
3,294
(3.8)
(2.5)
0.0
South Africa
Top 40
51,572
(3.7)
5.2
20.4
Mexico
Mexbol
46,973
(3.2)
(6.6)
1.3
Indonesia
LQ45
1,019
1.1
5.1
18.2
Malaysia
KLCI
1,718
(1.3)
(3.1)
5.6
Thailand
SET 50
1,091
1.1
5.5
16.6
USA
Dow Jones
24,141
2.6
10.7
23.5
UK
FTSE
7,348
(2.8)
(0.7)
6.0
Japan
Nikkei
22,177
(1.6)
12.6
21.1
Germany
DAX
12,999
(3.5)
7.2
16.0
France
CAC
5,374
(2.4)
5.1
12.7
Source: Bloomberg, Angel Research p68in4
Stock Watch
December 07, 2017
Company Name
Reco
CMP
Target
Mkt Cap
Sales ( Čcr )
OPM(%)
EPS (Č)
PER(x)
P/BV(x)
RoE(%)
EV/Sales(x)
(Č)
Price ( Č)
( Č cr )
FY18E FY19E
FY18E
FY19E
FY18E
FY19E
FY18E
FY19E
FY18E
FY19E
FY18E
FY19E
FY18E
FY19E
Agri / Agri Chemical
Rallis
Reduce
236
209
4,581
1,873
2,099
15.0
15.0
9.5
10.5
24.8
22.4
3.8
3.4
15.8
16.0
2.3
2.1
United Phosphorus
Buy
686
820
34,883
18,922
21,949
18.0
18.5
36.2
45.6
19.0
15.1
4.0
3.3
22.7
23.8
2.0
1.7
Auto & Auto Ancillary
Ashok Leyland
Accumulate
115
127
33,530
23,339
27,240
10.1
10.8
4.7
6.2
24.6
18.4
4.9
4.3
20.0
23.6
1.4
1.2
Bajaj Auto
Neutral
3,109
-
89,953
23,936
27,955
19.5
20.1
142.7
167.3
21.8
18.6
4.7
4.2
21.8
22.8
3.3
2.8
Bharat Forge
Buy
696
875
32,426
7,637
8,755
21.7
23.2
36.1
47.3
19.3
14.7
3.5
3.0
18.5
20.8
4.1
3.5
Eicher Motors
Neutral
28,158
-
76,653
19,043
22,837
19.5
19.9
835.4
1,019.0
33.7
27.6
12.6
9.7
40.9
37.8
3.9
3.2
Gabriel India
Neutral
187
-
2,684
1,782
2,033
9.7
10.2
7.1
8.9
26.3
21.1
5.3
4.5
21.0
22.2
1.5
1.3
Hero Motocorp
Buy
3,500
4,129
69,904
32,239
36,878
16.0
15.6
184.4
206.5
19.0
17.0
6.0
5.2
31.3
30.7
2.0
1.7
Jamna Auto Industries Neutral
63
-
2,506
1,441
1,662
14.4
14.8
13.9
17.6
4.5
3.6
1.2
1.0
30.0
31.0
1.7
1.5
Mahindra and Mahindra Neutral
1,370
-
85,180
46,971
53,816
13.6
14.0
67.7
79.8
20.2
17.2
2.9
2.6
15.0
15.9
1.7
1.4
Maruti
Accumulate
8,601
9,489
259,809
79,470
95,208
15.9
17.2
281.7
363.8
30.5
23.6
6.6
5.4
21.7
22.8
2.9
2.4
Minda Industries
Neutral
1,104
-
9,539
4,328
5,084
11.0
11.9
27.3
36.4
40.5
30.3
8.6
6.7
23.1
25.6
2.3
1.9
Motherson Sumi
Neutral
357
-
75,102
55,937
64,445
10.8
11.4
16.9
21.1
21.1
17.0
4.7
4.8
25.2
25.4
1.4
1.2
Tata Motors
Neutral
397
-
114,570
303,167
343,649
11.8
13.8
33.1
54.7
12.0
7.3
2.0
1.6
16.9
23.0
0.4
0.4
TVS Motor
Neutral
734
-
34,876
13,992
16,216
9.0
9.4
17.1
20.3
43.1
36.2
11.4
8.8
29.7
27.7
2.4
2.0
Amara Raja Batteries
Accumulate
764
858
13,049
6,140
7,122
14.3
15.6
29.3
39.0
26.1
19.6
4.5
3.7
17.1
19.0
2.1
1.8
Exide Industries
Neutral
203
-
17,221
8,689
9,854
15.1
15.2
9.7
11.0
21.0
18.4
3.7
3.3
15.7
16.1
1.7
1.5
Apollo Tyres
Neutral
238
-
13,621
15,739
17,326
13.3
14.6
20.4
26.7
11.7
8.9
1.4
1.2
20.4
26.7
1.1
1.0
Ceat
Neutral
1,702
-
6,883
6,661
7,717
11.1
14.2
116.2
178.2
14.7
9.6
2.5
2.1
15.2
21.3
1.1
1.0
JK Tyres
Neutral
136
-
3,090
8,318
9,239
16.2
16.4
21.0
27.5
6.5
5.0
1.3
1.0
19.1
20.4
0.8
0.7
Swaraj Engines
Neutral
1,950
-
2,422
788
889
16.4
16.5
71.6
81.0
27.2
24.1
7.9
7.3
29.6
31.0
2.7
2.4
Subros
Neutral
251
-
1,508
1,855
2,135
11.6
11.8
10.3
14.7
24.5
17.2
3.7
3.2
15.8
19.1
1.0
0.9
Capital Goods
BEML
Neutral
1,511
-
6,291
4,286
5,194
7.1
8.2
42.9
58.1
35.2
26.0
2.9
2.6
7.6
8.7
1.5
1.2
Bharat Electronics
Neutral
179
-
44,017
10,258
12,470
19.6
19.5
7.3
8.6
24.5
20.8
0.5
0.4
20.4
21.9
3.8
3.1
Voltas
Neutral
601
-
19,893
6,778
8,004
9.6
11.0
17.1
22.4
35.2
26.8
8.4
7.4
17.7
19.8
2.6
2.2
BHEL
Neutral
90
-
33,171
33,200
39,167
6.8
9.5
6.2
11.2
14.6
8.1
0.7
0.6
4.6
8.0
0.6
0.4
Blue Star
Accumulate
759
867
7,280
5,220
6,207
6.3
6.6
16.8
22.3
45.2
34.1
9.0
7.9
19.9
23.3
1.4
1.1
CG Power and Industrial
Neutral
83
-
5,186
6,555
7,292
7.5
7.5
-
0.8
8,275.0
103.4
1.3
1.3
0.1
1.2
0.9
0.8
Solutions
Greaves Cotton
Neutral
119
-
2,898
1,778
1,993
14.7
15.1
8.1
9.1
14.7
13.0
3.3
3.1
21.8
23.6
1.4
1.2
Stock Watch
December 07, 2017
Company Name
Reco
CMP
Target
Mkt Cap
Sales ( Čcr )
OPM(%)
EPS (Č)
PER(x)
P/BV(x)
RoE(%)
EV/Sales(x)
(Č)
Price ( Č)
( Č cr )
FY18E FY19E
FY18E
FY19E
FY18E
FY19E
FY18E
FY19E
FY18E
FY19E
FY18E
FY19E
FY18E
FY19E
Capital Goods
KEC International
Accumulate
313
350
8,047
9,779
11,113
9.4
9.8
14.2
18.2
22.0
17.2
4.2
3.5
21.1
22.1
1.1
1.0
KEI Industries
Accumulate
386
425
3,024
3,001
3,391
10.0
10.0
13.0
16.1
29.7
24.0
5.4
4.5
18.2
18.7
1.2
1.0
Thermax
Neutral
1,081
-
12,879
4,125
4,747
10.3
10.8
26.7
31.5
40.5
34.3
4.5
4.1
11.2
12.0
2.9
2.5
VATech Wabag
Accumulate
599
681
3,269
3,867
4,126
9.6
10.0
34.9
39.8
17.2
15.1
2.8
2.4
17.7
17.5
0.9
0.8
Cement
ACC
Neutral
1,689
-
31,708
12,255
13,350
13.5
14.3
58.0
66.2
29.1
25.5
3.5
3.2
11.5
12.2
2.6
2.3
Ambuja Cements
Neutral
261
-
51,875
10,250
11,450
17.5
19.0
7.2
8.3
36.3
31.5
2.6
2.5
7.0
7.8
4.8
4.3
India Cements
Neutral
164
-
5,066
6,135
6,750
14.8
15.2
8.5
11.5
19.3
14.3
1.0
0.9
4.8
6.2
1.2
1.0
JK Cement
Neutral
998
-
6,978
4,150
4,775
19.2
20.0
49.0
63.5
20.4
15.7
3.2
2.8
17.0
18.5
2.1
1.8
J K Lakshmi Cement
Neutral
412
-
4,845
3,422
3,757
15.5
17.0
13.5
23.2
30.5
17.8
3.2
2.7
10.8
15.5
1.8
1.6
Orient Cement
Neutral
165
-
3,378
2,215
3,233
16.8
17.0
5.9
6.9
28.0
23.9
2.1
2.0
10.8
10.1
2.5
1.7
UltraTech Cement
Neutral
4,034
-
110,745
28,250
35,150
20.2
23.5
77.5
122.2
52.1
33.0
4.4
4.0
9.6
14.8
4.4
3.5
Construction
KNR Constructions
Neutral
277
-
3,901
1,846
2,203
14.5
14.5
12.1
13.7
22.9
20.3
1.3
1.1
17.5
16.7
2.2
1.8
Larsen & Toubro
Neutral
1,190
-
166,730
95,787
109,476
10.2
11.6
44.5
50.8
26.8
23.5
3.4
3.1
12.9
13.1
2.3
2.0
Gujarat Pipavav Port
Neutral
139
-
6,713
739
842
61.6
62.7
5.1
6.2
27.2
22.6
3.4
3.3
12.7
14.9
8.5
7.4
PNC Infratech
Neutral
187
-
4,804
2,040
2,935
13.0
13.0
6.4
9.0
29.3
20.8
0.8
0.7
9.7
12.2
2.4
1.7
Simplex Infra
Neutral
594
-
2,938
6,012
6,619
11.6
11.7
21.1
31.0
28.2
19.2
2.0
1.8
6.5
8.6
1.0
0.9
Sadbhav Engineering
Neutral
369
-
6,339
3,823
4,426
10.7
10.8
10.3
11.8
35.9
31.3
4.3
3.8
10.1
10.5
2.0
1.7
NBCC
Neutral
254
-
22,860
9,099
12,706
6.4
6.4
7.3
9.6
34.9
26.6
1.5
1.2
27.5
30.5
2.4
1.7
MEP Infra
Neutral
94
-
1,522
2,403
2,910
18.3
16.8
2.4
6.1
39.8
15.4
15.1
10.2
35.2
55.8
1.8
1.5
SIPL
Neutral
133
-
4,692
2,060
2,390
46.8
47.7
(5.8)
(3.1)
5.0
5.7
(14.2)
(2.3)
7.0
6.5
Engineers India
Neutral
181
-
12,221
1,795
2,611
21.1
22.4
5.9
8.1
30.7
22.4
2.2
2.1
12.9
16.1
5.2
3.4
Financials
Axis Bank
Accumulate
530
580
127,068
32,558
35,843
3.5
3.2
27.8
41.0
19.1
12.9
2.1
1.8
11.4
14.9
-
-
Bank of Baroda
Neutral
166
-
38,238
22,533
26,079
2.4
2.4
12.0
20.9
13.8
7.9
0.9
0.9
6.6
11.0
-
-
Canara Bank
Neutral
363
-
21,682
17,925
20,235
2.0
2.1
18.5
36.5
19.6
10.0
0.7
0.7
3.4
6.2
-
-
Can Fin Homes
Neutral
458
-
6,095
586
741
3.5
3.5
107.8
141.0
4.3
3.3
0.9
0.8
24.1
25.6
-
-
Cholamandalam Inv. &
Neutral
1,280
-
20,007
2,826
3,307
6.3
6.3
53.7
64.6
23.9
19.8
4.1
3.5
18.3
18.9
-
-
Fin. Co.
Dewan Housing Finance Buy
586
712
18,377
2,676
3,383
2.4
2.7
37.4
49.7
15.7
11.8
2.1
1.8
13.8
16.2
-
-
Equitas Holdings
Buy
139
235
4,712
1,125
1,380
9.6
9.8
1.5
6.0
92.5
23.1
2.1
2.0
2.4
8.2
-
-
Federal Bank
Buy
108
125
21,152
4,896
5,930
2.8
3.1
5.4
7.6
20.1
14.2
1.7
1.6
8.5
11.0
-
-
Stock Watch
December 07, 2017
Company Name
Reco
CMP
Target
Mkt Cap
Sales ( Čcr )
OPM(%)
EPS (Č)
PER(x)
P/BV(x)
RoE(%)
EV/Sales(x)
(Č)
Price ( Č)
( Č cr )
FY18E FY19E
FY18E
FY19E
FY18E
FY19E
FY18E
FY19E
FY18E
FY19E
FY18E
FY19E
FY18E
FY19E
Financials
GIC Housing
Buy
408
655
2,200
376
477
3.6
3.7
33.0
40.0
12.4
10.2
2.2
1.9
20.0
23.0
-
-
HDFC Bank
Neutral
1,802
-
466,460
55,236
63,253
4.5
4.4
68.9
82.4
26.2
21.9
4.6
3.8
18.7
18.5
-
-
ICICI Bank
Accumulate
299
315
192,252
42,361
51,378
3.6
3.9
18.4
25.7
16.3
11.6
1.8
1.7
11.3
15.0
-
-
Karur Vysya Bank
Buy
114
180
8,205
3,289
3,630
3.7
3.9
10.8
14.1
10.5
8.1
1.3
1.1
12.5
14.7
-
-
LIC Housing Finance
Accumulate
555
630
28,011
4,895
6,332
3.4
3.7
50.7
66.8
10.9
8.3
2.2
1.8
21.7
23.8
-
-
Punjab Natl.Bank
Neutral
172
-
36,612
23,708
25,758
2.1
2.1
5.9
16.4
29.3
10.5
0.9
0.8
3.0
8.3
-
-
RBL Bank
Neutral
510
-
21,234
2,309
2,888
2.6
2.5
16.4
19.1
31.2
26.7
3.9
3.5
13.3
13.8
-
-
Repco Home Finance
Buy
610
825
3,819
496
597
4.4
4.2
38.5
48.7
15.9
12.5
2.9
2.4
19.6
20.6
-
-
South Ind.Bank
Neutral
31
-
5,616
3,195
3,567
3.0
3.1
3.0
3.8
10.3
8.1
1.0
0.9
10.5
11.9
-
-
St Bk of India
Neutral
312
-
269,536
105,827
121,056
2.4
2.5
16.1
25.6
19.4
12.2
1.5
1.4
6.6
9.9
-
-
Union Bank
Neutral
155
-
11,281
14,650
16,225
2.3
2.3
23.1
32.5
6.7
4.8
0.5
0.5
7.1
9.2
-
-
Yes Bank
Neutral
306
-
70,353
11,088
13,138
3.0
2.9
84.0
99.3
3.6
3.1
0.6
0.5
16.3
16.8
-
-
FMCG
Akzo Nobel India
Neutral
1,784
-
8,556
3,164
3,607
13.8
13.7
58.6
67.9
30.5
26.3
7.5
6.6
24.5
25.1
2.6
2.2
Asian Paints
Neutral
1,104
-
105,910
17,603
20,615
18.6
18.6
2,128.9
2,543.3
0.5
0.4
10.9
9.2
28.0
28.9
5.8
4.9
Britannia
Neutral
4,756
-
57,095
9,690
11,278
14.8
15.4
84.0
101.0
56.6
47.1
20.6
16.4
40.6
39.0
5.9
5.0
Colgate
Neutral
1,038
-
28,242
4,420
5,074
24.9
25.3
28.6
32.8
36.3
31.7
14.3
11.6
43.8
40.5
6.1
5.3
Dabur India
Neutral
341
-
60,138
8,346
9,344
19.6
19.9
7.8
9.0
43.8
37.9
8.8
8.0
25.2
24.8
6.8
6.0
GlaxoSmith Con*
Neutral
6,100
-
25,656
5,072
5,760
18.2
18.4
176.3
199.2
34.6
30.6
7.3
6.6
21.2
21.7
4.4
3.8
Godrej Consumer
Neutral
1,002
-
68,242
10,171
11,682
20.8
21.5
21.7
27.1
46.2
37.0
10.4
8.9
22.3
23.4
6.8
5.9
HUL
Neutral
1,274
-
275,722
37,077
41,508
20.3
21.8
5,189.9
6,318.5
0.3
0.2
38.8
33.2
74.8
82.0
7.3
6.5
ITC
Neutral
251
-
306,473
44,588
49,853
37.0
37.3
9.6
11.0
26.2
22.9
6.4
6.1
25.1
27.3
6.4
5.7
Marico
Neutral
306
-
39,543
6,788
7,766
18.5
19.2
7.1
8.5
43.2
36.0
15.1
12.9
36.9
38.0
5.7
4.9
Nestle*
Neutral
7,676
-
74,007
10,083
11,182
20.0
20.9
119.7
141.3
64.1
54.3
226.0
206.6
36.7
39.8
7.0
6.3
Tata Global
Neutral
275
-
17,350
7,121
7,641
11.9
12.3
6.9
8.0
39.8
34.4
2.7
2.5
6.8
7.2
2.2
2.1
Procter & Gamble
Neutral
9,666
-
31,375
3,034
3,579
27.1
27.7
167.7
198.8
57.6
48.6
15.5
13.3
28.8
29.5
9.8
8.2
Hygiene
IT
HCL Tech^
Buy
857
1,014
122,293
50,009
54,608
22.1
22.1
62.8
67.6
13.7
12.7
3.1
2.6
22.4
20.6
2.1
1.8
Infosys
Accumulate
990
1,120
227,494
70,333
75,960
26.0
26.0
61.7
65.9
16.1
15.0
3.0
2.8
18.9
18.7
2.6
2.4
TCS
Reduce
2,631
2,442
503,735
123,384
134,488
26.1
26.1
133.2
143.7
19.8
18.3
5.5
5.1
27.6
27.8
3.7
3.4
Tech Mahindra
Accumulate
472
526
46,052
30,545
32,988
15.0
15.0
35.2
37.6
13.4
12.5
2.3
2.1
16.8
16.2
1.3
1.1
Stock Watch
December 07, 2017
Company Name
Reco
CMP
Target
Mkt Cap
Sales ( Čcr )
OPM(%)
EPS (Č)
PER(x)
P/BV(x)
RoE(%)
EV/Sales(x)
(Č)
Price ( Č)
( Č cr )
FY18E FY19E
FY18E
FY19E
FY18E
FY19E
FY18E
FY19E
FY18E
FY19E
FY18E
FY19E
FY18E
FY19E
IT
Wipro
Neutral
282
-
137,387
54,164
56,544
22.3
22.3
18.8
19.5
15.0
14.5
2.4
2.1
15.0
13.6
1.8
1.5
Media
D B Corp
Neutral
356
-
6,550
2,404
2,625
30.5
31.5
23.7
26.9
15.0
13.2
3.5
3.0
23.5
22.8
2.6
2.3
HT Media
Neutral
99
-
2,302
2,589
2,830
15.1
15.4
8.3
10.9
11.9
9.1
1.0
0.9
8.4
10.4
0.4
0.3
Jagran Prakashan
Buy
164
225
5,115
2,541
2,835
28.5
28.7
12.7
14.1
12.9
11.7
2.7
2.3
21.3
21.4
1.9
1.6
Sun TV Network
Neutral
842
-
33,168
3,238
3,789
51.9
55.1
30.9
38.0
27.2
22.2
7.8
6.8
30.0
31.0
9.8
8.2
Hindustan Media
Neutral
242
-
1,775
1,002
1,074
23.3
23.5
29.2
33.8
8.3
7.2
1.3
1.1
15.6
15.4
0.8
0.5
Ventures
TV Today Network
Accumulate
391
435
2,335
667
727
27.7
27.7
18.6
20.1
21.0
19.5
3.3
3.3
15.6
17.3
3.0
2.8
Music Broadcast Limited Accumulate
388
434
2,212
271
317
91.0
109.0
6.0
10.0
64.6
38.8
4.0
3.7
6.5
9.3
7.8
6.4
Metals & Mining
Coal India
Neutral
265
-
164,496
82,301
91,235
17.0
18.0
17.1
20.5
15.5
12.9
2.9
2.7
45.0
55.0
1.7
1.5
Hind. Zinc
Neutral
286
-
120,865
22,108
24,555
57.0
58.0
22.1
26.3
12.9
10.9
4.2
3.4
32.0
35.0
4.5
3.7
Hindalco
Neutral
232
-
52,011
102,350
105,355
13.5
14.5
21.5
24.5
10.8
9.5
1.5
1.3
15.0
15.2
1.1
1.0
JSW Steel
Neutral
242
-
58,606
64,500
68,245
21.1
21.5
20.1
21.2
12.1
11.4
2.2
1.9
-
-
1.6
1.6
NMDC
Neutral
128
-
40,609
10,209
11,450
47.0
48.0
11.1
12.1
11.6
10.6
1.6
1.5
-
-
3.5
3.2
SAIL
Neutral
76
-
31,347
54,100
63,555
3.0
10.0
(10.0)
1.5
50.6
1.0
1.0
-
-
1.6
1.3
Vedanta
Neutral
282
-
104,751
81,206
87,345
28.0
29.0
26.5
33.5
10.6
8.4
2.4
2.1
-
-
2.0
1.7
Tata Steel
Neutral
668
-
64,882
121,445
126,500
16.2
17.2
65.4
81.3
10.2
8.2
1.6
1.4
-
-
1.1
0.9
Oil & Gas
GAIL
Neutral
456
-
77,183
53,115
52,344
14.2
15.3
30.0
31.1
15.2
14.7
1.9
1.8
-
-
1.2
1.2
ONGC
Neutral
176
-
225,608
83,111
84,934
44.2
44.9
16.4
16.9
10.7
10.4
1.3
1.2
-
-
2.6
2.6
Indian Oil Corp
Neutral
389
-
188,676
396,116
432,560
8.5
8.8
40.1
42.2
9.7
9.2
1.7
1.5
-
-
0.6
0.6
Reliance Industries
Neutral
928
-
603,228
257,711
267,438
17.0
18.2
89.1
89.5
10.4
10.4
1.0
0.9
-
-
2.0
1.9
Pharmaceuticals
Alembic Pharma
Buy
513
600
9,675
3,346
3,915
19.6
19.2
21.0
23.9
24.4
21.5
4.3
3.7
19.1
18.4
2.9
2.5
Alkem Laboratories Ltd
Accumulate
2,072
2,252
24,774
6,320
7,341
17.5
19.8
72.7
96.6
28.5
21.5
5.0
4.3
16.7
18.7
3.9
3.3
Aurobindo Pharma
Buy
654
823
38,290
17,086
19,478
22.1
22.0
44.7
51.4
14.6
12.7
3.2
2.6
24.7
22.7
2.4
2.1
Aventis*
Neutral
4,345
-
10,007
2,411
2,698
18.8
18.8
151.6
163.9
28.7
26.5
4.5
3.6
25.4
27.5
3.7
3.1
Cadila Healthcare
Neutral
419
-
42,936
11,365
12,926
20.0
20.0
18.4
20.5
22.8
20.5
5.0
4.1
24.3
22.2
3.9
3.3
Cipla
Sell
596
462
47,927
16,163
18,711
16.6
16.9
20.7
24.3
28.8
24.5
3.4
3.0
12.6
13.1
3.1
2.6
Dr Reddy's
Reduce
2,195
2,040
36,397
13,734
15,548
17.7
20.2
69.9
102.0
31.4
21.5
2.8
2.5
9.2
12.4
2.9
2.5
GSK Pharma*
Sell
2,448
2,000
20,734
2,968
3,324
13.8
15.9
37.8
46.3
64.8
52.9
11.3
12.4
16.7
22.4
6.8
6.2
Indoco Remedies
Sell
262
136
2,417
1,114
1,297
9.9
13.9
5.6
11.4
46.8
23.0
3.5
3.2
7.7
14.5
2.4
2.1
Stock Watch
December 07, 2017
Company Name
Reco
CMP
Target
Mkt Cap
Sales ( Čcr )
OPM(%)
EPS (Č)
PER(x)
P/BV(x)
RoE(%)
EV/Sales(x)
(Č)
Price ( Č)
( Č cr )
FY18E FY19E
FY18E
FY19E
FY18E
FY19E
FY18E
FY19E
FY18E
FY19E
FY18E
FY19E
FY18E
FY19E
Pharmaceuticals
Ipca labs
Accumulate
530
570
6,686
3,256
3,647
14.1
17.1
16.2
25.4
32.7
20.9
2.5
2.3
8.0
11.5
2.1
1.9
Lupin
Buy
809
1,091
36,566
16,240
18,562
21.3
21.7
42.5
49.6
19.0
16.3
2.4
2.1
13.3
13.7
2.4
2.0
Natco Pharma
Accumulate
937
1,057
16,345
1,886
2,016
32.3
29.5
23.2
22.0
40.5
42.5
8.5
7.5
20.9
17.6
8.5
7.9
Sun Pharma
Buy
512
615
122,734
28,312
31,826
20.7
22.4
18.5
22.3
27.7
22.9
3.1
2.8
11.5
14.0
4.0
3.4
Syngene International
Accumulate
539
587
10,776
1,394
1,818
33.0
36.5
15.8
21.0
34.1
25.7
6.3
5.2
18.6
20.3
7.7
5.9
Power
Tata Power
Neutral
88
-
23,667
32,547
33,806
20.5
20.5
4.7
5.4
18.6
16.4
1.8
1.5
10.5
10.5
1.7
1.7
NTPC
Neutral
175
-
144,502
86,070
101,246
28.3
30.7
12.9
16.2
13.6
10.8
1.4
1.3
10.6
12.4
3.0
2.7
Power Grid
Accumulate
200
223
104,789
29,183
32,946
89.7
90.0
18.0
20.8
11.2
9.6
1.9
1.7
17.7
18.2
7.5
7.0
Real Estate
Prestige Estate
Neutral
305
-
11,428
4,607
5,146
21.0
22.2
7.9
9.8
38.6
31.1
2.4
2.2
10.3
12.0
3.7
3.3
MLIFE
Accumulate
460
522
2,359
487
590
12.3
17.8
21.0
31.2
21.9
14.7
1.1
1.1
5.2
7.4
3.6
2.9
Telecom
Bharti Airtel
Neutral
484
-
193,454
97,903
105,233
36.0
36.3
9.3
11.1
52.0
43.8
2.5
2.4
5.0
5.6
2.9
2.7
Idea Cellular
Neutral
93
-
33,603
35,012
37,689
27.1
27.7
(4.4)
(2.7)
1.5
1.5
(6.8)
(4.6)
2.3
2.0
zOthers
Abbott India
Neutral
5,503
-
11,694
3,244
3,723
14.9
16.1
167.5
209.4
32.9
26.3
7.2
6.1
23.7
24.8
3.3
2.8
Asian Granito
Buy
491
570
1,477
1,169
1,286
12.5
12.5
16.0
19.7
30.7
24.9
3.3
2.9
10.7
11.6
1.5
1.3
Bajaj Electricals
Neutral
473
-
4,813
4,646
5,301
6.7
7.6
16.1
22.3
29.4
21.2
4.8
4.1
16.4
19.2
1.0
0.9
Banco Products (India)
Neutral
237
-
1,692
1,530
1,695
13.2
12.7
19.0
20.0
12.5
11.8
2.0
1.8
0.2
0.2
1.0
113.3
Coffee Day Enterprises
Neutral
259
-
5,338
3,494
3,913
17.4
18.0
4.8
5.7
-
45.5
2.3
2.2
-
0.1
2.0
1.7
Ltd
Elecon Engineering
Neutral
87
-
981
171
201
15.0
16.2
36.0
43.0
2.4
2.0
0.2
0.2
0.1
0.1
5.1
4.3
Garware Wall Ropes
Neutral
922
-
2,018
928
1,003
15.2
15.2
39.4
43.2
23.4
21.4
3.9
3.3
16.5
15.4
2.0
1.8
Goodyear India*
Neutral
861
-
1,987
1,717
1,866
11.8
12.3
47.9
49.8
18.0
17.3
2.8
2.4
15.6
15.7
0.9
122.1
Hitachi
Neutral
2,520
-
6,851
2,355
2,715
10.3
10.8
49.0
60.9
51.4
41.4
12.0
9.5
0.2
0.2
2.9
2.5
HSIL
Neutral
491
-
3,547
2,240
2,670
14.6
15.0
17.0
22.0
28.9
22.3
2.4
2.3
0.1
0.1
1.8
1.5
Interglobe Aviation
Neutral
1,137
-
43,698
22,570
27,955
14.2
15.0
63.6
81.8
17.9
13.9
9.4
8.0
0.5
0.6
1.6
1.2
Jyothy Laboratories
Neutral
368
-
6,692
1,781
2,044
14.1
15.0
9.4
10.5
39.4
35.1
8.4
7.9
0.2
0.2
4.0
3.4
Linc Pen & Plastics
Neutral
305
-
451
420
462
9.3
9.3
15.3
17.1
20.0
17.8
3.4
3.5
16.9
19.5
1.1
1.0
M M Forgings
Neutral
932
-
1,125
542
642
20.1
21.0
41.6
56.8
22.4
16.4
3.1
2.6
0.1
0.2
2.5
2.2
Mirza International
Neutral
158
-
1,903
1,148
1,285
18.0
18.0
8.0
9.4
19.7
16.9
3.3
2.8
16.3
16.1
1.8
1.6
Navkar Corporation
Buy
181
265
2,729
561
617
41.5
41.5
11.5
12.7
15.8
14.3
1.7
1.5
10.5
10.4
5.5
4.8
Nilkamal
Neutral
1,788
-
2,669
2,317
2,525
11.4
11.1
96.0
105.0
18.6
17.0
3.2
2.8
0.2
0.2
1.1
1.0
Stock Watch
December 07, 2017
Company Name
Reco
CMP
Target Mkt Cap
Sales ( Čcr )
OPM(%)
EPS (Č)
PER(x)
P/BV(x)
RoE(%)
EV/Sales(x)
(Č)
Price ( Č)
( Č cr )
FY18E FY19E FY18E FY19E FY18E FY19E FY18E FY19E FY18E FY19E FY18E FY19E FY18E FY19E
zOthers
Parag Milk Foods
Neutral
245
-
2,060
1,987
2,379
7.6
9.0
12.4
18.3
19.8
13.4
2.8
2.4
8.2
13.2
1.2
1.0
Radico Khaitan
Neutral
274
-
3,648
1,811
1,992
13.2
13.2
8.1
8.8
33.8
31.1
3.4
3.7
10.1
12.0
2.3
2.1
Relaxo Footwears
Neutral
606
-
7,290
1,981
2,310
13.7
14.5
12.0
15.5
50.5
39.1
9.8
8.0
0.2
0.2
3.7
3.2
Siyaram Silk Mills
Accumulate
717
767
3,362
1,769
1,981
12.7
12.7
22.6
26.2
31.7
27.4
4.9
4.2
15.5
15.5
2.1
1.9
Styrolution ABS India* Neutral
1,054
-
1,854
1,800
1,980
8.0
8.1
42.0
46.2
25.1
22.8
2.8
2.5
0.1
0.1
1.1
1.1
Surya Roshni
Neutral
363
-
1,592
4,870
5,320
7.7
7.8
22.8
28.1
16.0
12.9
2.1
1.8
0.1
0.1
0.5
0.5
TVS Srichakra
Neutral
3,320
-
2,542
2,729
2,893
12.7
12.5
248.5
265.0
13.4
12.5
3.8
3.1
0.3
0.3
0.9
0.9
Visaka Industries
Neutral
609
-
967
1,104
1,214
12.1
12.6
31.0
37.9
19.7
16.1
2.4
2.1
0.1
0.1
1.1
1.0
VIP Industries
Buy
343
400
4,853
1,450
1,693
10.4
10.5
6.5
7.8
52.5
44.0
11.1
9.7
21.1
22.1
3.3
2.9
Navin Fluorine
Accumulate
692
730
3,412
945
1,154
17.5
17.9
28.7
34.8
24.1
19.9
4.0
3.4
-
-
3.1
2.4
Source: Company, Angel Research; Note: *December year end; #September year end; &October year end; Price as on December 06, 2017
Market Outlook
December 07, 2017
Research Team Tel: 022 - 39357800
DISCLAIMER
Angel Broking Private Limited (hereinafter referred to as “Angel”) is a registered Member of National Stock Exchange of India
Limited,Bombay Stock Exchange Limited and Metropolitan Stock Exchange Limited. It is also registered as a Depository Participant with
CDSL and Portfolio Manager with SEBI. It also has registration with AMFI as a Mutual Fund Distributor. Angel Broking Private Limited is a
registered entity with SEBI for Research Analyst in terms of SEBI (Research Analyst) Regulations, 2014 vide registration number
INH000000164. Angel or its associates has not been debarred/ suspended by SEBI or any other regulatory authority for accessing
/dealing in securities Market. Angel or its associates/analyst has not received any compensation / managed or
co-managed public offering of securities of the company covered by Analyst during the past twelve months.
This document is solely for the personal information of the recipient, and must not be singularly used as the basis of any investment
decision. Nothing in this document should be construed as investment or financial advice. Each recipient of this document should make
such investigations as they deem necessary to arrive at an independent evaluation of an investment in the securities of the companies
referred to in this document (including the merits and risks involved), and should consult their own advisors to determine the merits and
risks of such an investment.
Reports based on technical and derivative analysis center on studying charts of a stock's price movement, outstanding positions and
trading volume, as opposed to focusing on a company's fundamentals and, as such, may not match with a report on a company's
fundamentals. Investors are advised to refer the Fundamental and Technical Research Reports available on our website to evaluate the
contrary view, if any.
The information in this document has been printed on the basis of publicly available information, internal data and other reliable
sources believed to be true, but we do not represent that it is accurate or complete and it should not be relied on as such, as this
document is for general guidance only. Angel Broking Pvt. Limited or any of its affiliates/ group companies shall not be in any way
responsible for any loss or damage that may arise to any person from any inadvertent error in the information contained in this report.
Angel Broking Pvt. Limited has not independently verified all the information contained within this document. Accordingly, we cannot
testify, nor make any representation or warranty, express or implied, to the accuracy, contents or data contained within this document.
While Angel Broking Pvt. Limited endeavors to update on a reasonable basis the information discussed in this material, there may be
regulatory, compliance, or other reasons that prevent us from doing so.
This document is being supplied to you solely for your information, and its contents, information or data may not be reproduced,
redistributed or passed on, directly or indirectly.
Neither Angel Broking Pvt. Limited, nor its directors, employees or affiliates shall be liable for any loss or damage that may arise from
or in connection with the use of this information.